When a zero result means three different things
Why does a SCHD calculator show zero?
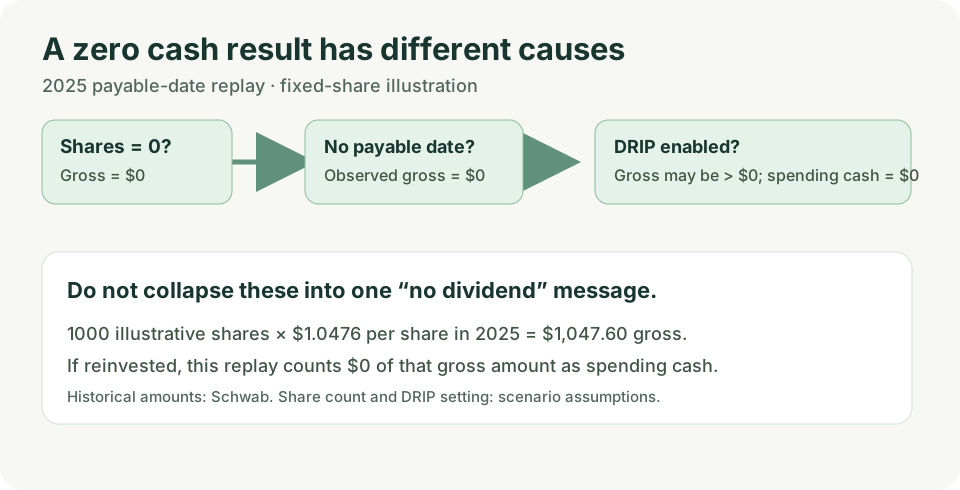
Zero shares, no payable date, or DRIP: each can produce a zero cash result for a different reason.
First check the unit that is zero. Zero assumed shares produces zero gross distribution. A date window with no SCHD payable date produces zero observed cash in that window. Turning on dividend reinvestment can leave zero cash available for spending even when gross distributions are positive. These results answer different questions and should not share one vague “no dividends” label.
This page replays four published 2025 SCHD distributions. It does not predict the next payout or determine whether your own account was entitled to a past one.
Hold one historical source fixed
Schwab's SCHD distribution history lists 2025 payable dates and per-share amounts: March 31 ($0.2488), June 30 ($0.2602), September 29 ($0.2604) and December 15 ($0.2782). I checked those rows against the issuer page on September 27, 2026. Their sum is $1.0476 per share. The 1,000-share examples below are hypothetical fixed holdings, not a statement about an actual account.
The calculation is deliberately narrow: select 2025 payable dates within an inclusive start/end window, add their per-share distributions, then multiply by assumed shares. Gross = shares × included per-share sum. Spending cash = gross if reinvestment is off; this educational replay sets spending cash to zero if reinvestment is on. The displayed result rounds once to the nearest cent after summing included distributions. It does not simulate additional shares, execution prices, taxes or broker credit delays.
Six reproducible boundary cases
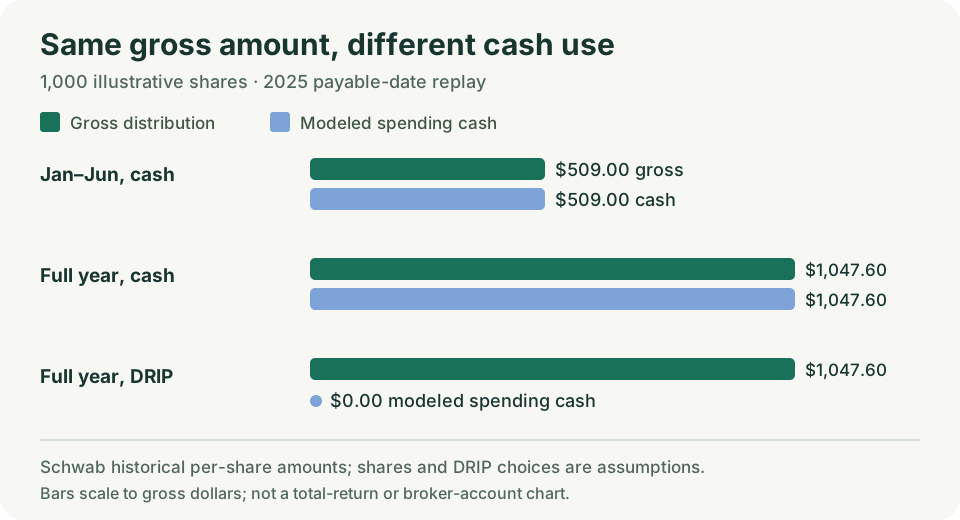
Each row changes one condition while retaining the same issuer payment records. “Matched” counts payable dates, not ex-dates. The no-shares row still matches four dates but produces zero dollars; the empty-window row matches none even with 1,000 assumed shares. The last two rows have the same gross amount and different spending-cash treatment.
| Case | Assumed shares | 2025 payable window | Matched | Gross | Spending cash |
|---|---|---|---|---|---|
| No shares | 0 | Jan 1–Dec 31 | 4 | $0.00 | $0.00 |
| No payable date | 1,000 | Jan 1–Mar 30 | 0 | $0.00 | $0.00 |
| March included | 1,000 | Jan 1–Mar 31 | 1 | $248.80 | $248.80 |
| First half | 1,000 | Jan 1–Jun 30 | 2 | $509.00 | $509.00 |
| Full year, cash | 1,000 | Jan 1–Dec 31 | 4 | $1,047.60 | $1,047.60 |
| Full year, DRIP | 1,000 | Jan 1–Dec 31 | 4 | $1,047.60 | $0.00 |
Download the test cases as CSV. Reproduce the first-half row: (0.2488 + 0.2602) × 1,000 = $509.00. A window ending March 30 excludes the March 31 payable date; moving the end to March 31 adds $248.80. The March ex-date is earlier, so an ex-date-based calculator may answer a different question even when it uses the same source record.
Try a fixed-share payment-window replay
Choose assumed shares, an inclusive window within 2025, and how to treat reinvestment. The tool tells you both matched payments and gross distributions. It rejects negative shares, reversed dates and dates outside its source year instead of silently returning zero. It assumes eligibility for every included historical payment; that assumption may not fit your trade dates.
Default case: four payable dates; $1,047.60 gross and $1,047.60 modeled spending cash.
Schwab explains that its DRIP automatically reinvests cash dividends into additional whole or fractional shares. This tool does not reproduce its execution or tax records. For a household bill, use the separate cash-timing ledger, which accounts for when cash arrives relative to expenses.
Questions the zero should answer
Does zero monthly contribution mean zero SCHD dividends?
No. Contributions add new capital. If you already hold eligible shares, setting new contributions to zero does not make the distribution on those existing shares zero. This fixed-share replay does not even require a contribution input.
Does a zero result before March 31 mean SCHD made no distribution in 2025?
No. The selected window ended before its first 2025 payable date. Extend the window or inspect the full issuer history before drawing a year-wide conclusion.
Is a reinvested dividend a zero return?
No. The gross distribution can be positive while the modeled cash available to spend is zero. Reinvestment changes what happened to the cash; it is not proof of a zero distribution or a gain. Account value and total return require other inputs.
Should missing or invalid data be shown as $0?
No. A missing source row, an invalid date, negative shares, or a failed fetch is an error or unknown state. Zero is a valid calculated result only after the inputs and covered history are known.
Watch the three boundary tests
Watch the DividendSteps walkthrough on YouTube. It uses the same historical source rows and illustrative share count, with synthetic English narration. The full matrix and interactive test are above.
For a separate import-coverage test, see the missing-data subtotal and completeness worksheet.
Do not turn missing coverage into a zero
The historical examples above use a fixed known source. An imported collection needs a separate completeness check. This diagram uses synthetic A/B/C records, not SCHD payments.
