Monthly income.
Quarterly cash.
Can SCHD dividends cover a monthly bill?
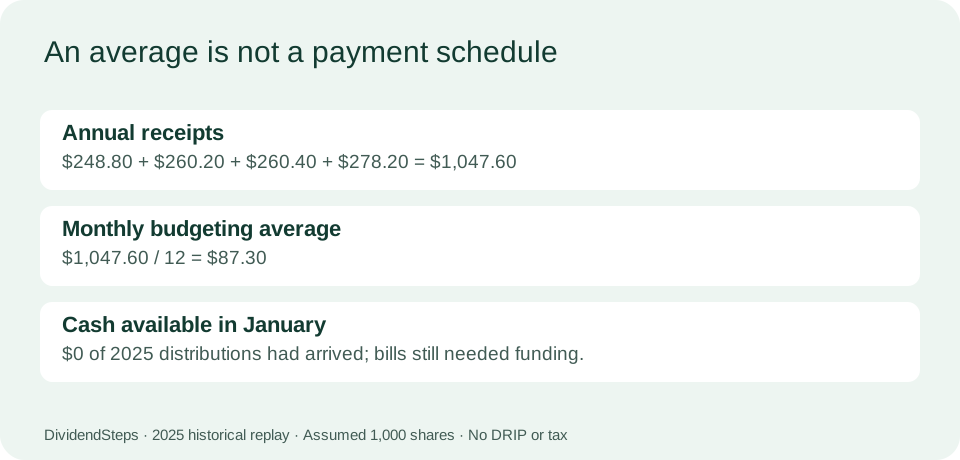
A monthly average does not tell you whether cash is available when the bill is due. In this 2025 replay, an assumed 1,000 SCHD shares produced $1,047.60 before tax, averaging $87.30 per month. Paying an assumed $80 bill on the first of each month required $240 of cash at the start, because the first distribution arrived on March 31.
This is a historical cash-timing exercise, not a forecast or a suggested investment size. It assumes eligibility for all four distributions, no reinvestment, no share sales, no taxes, no fees and immediate cash availability on the official payable date.
The dates and assumptions behind the example
The four source observations are Schwab payable dates and distributions per share: March 31 ($0.2488), June 30 ($0.2602), September 29 ($0.2604) and December 15 ($0.2782), all in 2025. These were rechecked against Schwab’s distribution history on September 26, 2026. The share count of 1,000 and the $80 monthly bill are our illustrative inputs, not market observations.
Annual cash = 1,000 × (0.2488 + 0.2602 + 0.2604 + 0.2782) = $1,047.60. Monthly average = $1,047.60 ÷ 12 = $87.30. Yearly bills = 12 × $80 = $960. Receipts exceed these bills by $87.60 over the year, but that surplus does not fund the first bill before any payment arrives.
Replay the cash balance, one event at a time
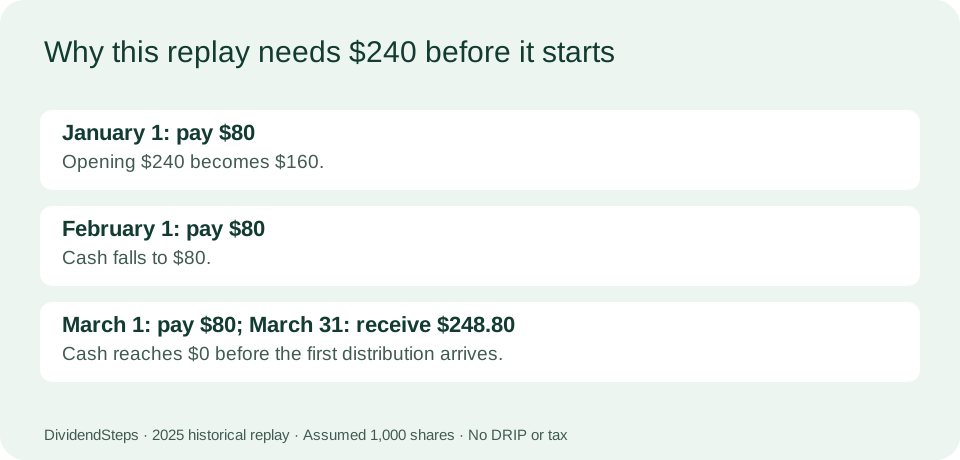
Begin with $240 in a separate cash balance on January 1. Deduct the bill before adding any later payment that month. The table follows actual payable dates instead of crediting one-twelfth of annual dividends every month. Every row can be recomputed as previous cash balance + event amount.
The cash amount belongs to this spending ledger. It is not added to the ETF’s share count or treated as another dividend. Cash interest is set to zero, so this example does not hide a savings-rate assumption.
| Date | Event | Cash change | Balance |
|---|---|---|---|
| 2025-01-01 | Expense | $-80.00 | $160.00 |
| 2025-02-01 | Expense | $-80.00 | $80.00 |
| 2025-03-01 | Expense | $-80.00 | $0.00 |
| 2025-03-31 | Distribution | $248.80 | $248.80 |
| 2025-04-01 | Expense | $-80.00 | $168.80 |
| 2025-05-01 | Expense | $-80.00 | $88.80 |
| 2025-06-01 | Expense | $-80.00 | $8.80 |
| 2025-06-30 | Distribution | $260.20 | $269.00 |
| 2025-07-01 | Expense | $-80.00 | $189.00 |
| 2025-08-01 | Expense | $-80.00 | $109.00 |
| 2025-09-01 | Expense | $-80.00 | $29.00 |
| 2025-09-29 | Distribution | $260.40 | $289.40 |
| 2025-10-01 | Expense | $-80.00 | $209.40 |
| 2025-11-01 | Expense | $-80.00 | $129.40 |
| 2025-12-01 | Expense | $-80.00 | $49.40 |
| 2025-12-15 | Distribution | $278.20 | $327.60 |
Download the complete event ledger (CSV). The balance reaches zero on March 1; the March 31 distribution rebuilds it. December ends at $327.60, comprising the original $240 cash plus the $87.60 excess of receipts over spending. Do not call that ending balance investment profit: this ledger omits the value and price movement of the shares.
Find the smallest opening cash amount for this replay
First run the dated events from a zero opening balance. Keep a cumulative sum after every event. The most negative point tells you how much opening cash would have prevented a negative balance: minimum opening cash = max(0, −minimum cumulative event sum).
For the $80 bill, the first three expenses take the cumulative sum to −$240 before the March payment. Later deficits from a zero start never exceed that amount. Adding $240 to every event balance therefore makes the minimum zero. A $239 start would leave a $1 shortage on March 1 even though the whole year’s dividends exceed the whole year’s bills.
This is a mathematical floor for known historical events, not a recommended emergency fund. It assumes no delays, no extra costs and complete receipt eligibility. If a broker credits a payment later, put that later date into the event list and recalculate. A month-end-only table can miss a first-of-month shortage, so the minimum must be taken over every event.
A counterexample: raise the bill to $100
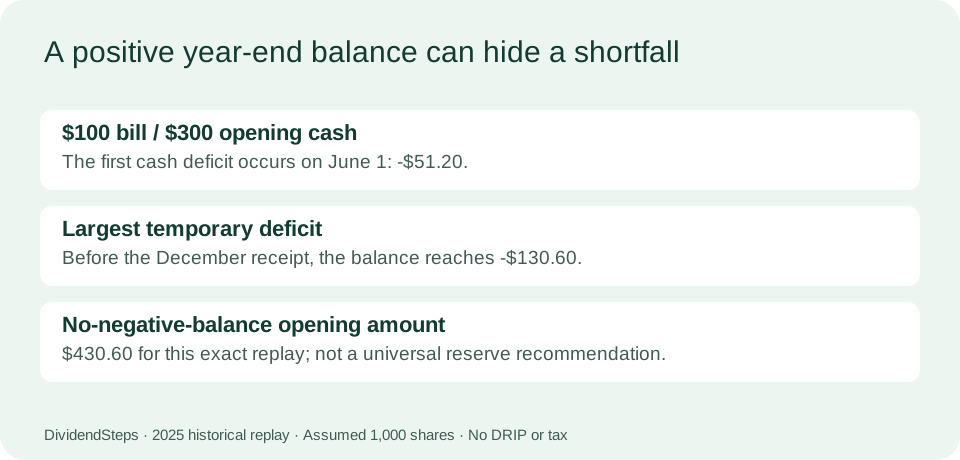
Keep the same 1,000 shares and the same observed distributions, but change only the spending input to $100 per month and the opening cash to $300. After three bills the cash balance is zero; the March receipt raises it to $248.80. April and May bills reduce it to $48.80, and the June 1 bill then makes it −$51.20 before the June payment.
The lowest balance is −$130.60 on December 1. The December 15 payment makes the ending balance positive again at $147.60. A positive ending balance therefore does not prove that every bill could have been paid on time. The zero-start cumulative minimum is −$430.60, giving a $430.60 opening-cash floor for this one-year sequence.
There is a second problem: the $1,200 yearly spending input exceeds the $1,047.60 historical receipts by $152.40. A larger opening balance covers that deficit for this replay; it does not remove the recurring income shortfall. Repeat only if you explicitly assume another year’s payment amounts and dates. Never silently recycle 2025 payments as a future guarantee.
Test your own illustrative inputs
The calculator below replays the same four 2025 observations. It changes only share count, monthly bill and starting cash. It does not retrieve a live yield, execute a trade or model future distributions. If you did not qualify for every historical payment, this fixed-share replay does not represent your actual receipts.
Default replay: minimum opening cash $240.00; lowest balance $0.00; year-end cash $327.60.
After changing an input, compare three outputs: the opening-cash floor, the lowest event balance with your chosen cash, and the year-end balance. The first answers a timing question; the last alone cannot answer it. A negative lowest balance means the scenario needs another funding source at that moment, even if receipts arrive later.
Questions to ask before using a monthly income figure
Does $87.30 per month mean SCHD paid every month?
No. It is $1,047.60 divided by twelve in this historical example. The underlying cash receipts occurred on four payable dates.
Can I count reinvested dividends as spending cash?
Not in this ledger. A dividend used to purchase additional shares is unavailable for the assumed household bill. A mixed reinvestment/spending model must split each receipt explicitly. Schwab explains how its DRIP purchases shares.
Does this calculate the amount I should invest?
No. It starts with an assumed share count and does not model a purchase price, capital losses, taxes or your other assets and liabilities. Use the SCHD dividend calculator for a separate growth scenario, and keep that scenario’s assumptions distinct from this historical cash replay.
Where should I check the next payment?
Check the issuer’s dated declaration and your broker’s account records. See our payment-date guide for the distinction between eligibility and cash arrival. Do not infer an announced amount from an annualized yield.
Watch the cash-flow walkthrough
Watch the DividendSteps explanation on YouTube. The video uses the same historical inputs and original diagrams, with synthetic English narration. Opening YouTube is optional; the full calculation is on this page.
Separate a receipt target from a dated reserve
The historical ledger above uses an opening cash balance. A different instruction takes a fixed amount from each receipt and reinvests its surplus. It can leave later targets unfunded. See the cash-budget allocation worksheet for an explicitly hypothetical comparison.
