SCHD 2025 yield methods: a price and payout audit
A 2025 calculation
Schwab's four 2025 SCHD income distributions add to $1.0476 per share. Dividing that closed-year sum by an assumed $25 cost gives 4.1904%. Multiplying only the final $0.2782 payment by four and dividing by the same assumed $25 gives 4.4512%. The 0.2608-percentage-point difference comes from the numerator, not a changed account balance. Neither is Schwab's current published yield or a forecast.
These are historical-arithmetic illustrations for checking a calculator's labels. For dated current issuer figures and the longer payment file, see our SCHD dividend yield reference. The $25 and $30 prices and 1,000 shares below are hypothetical, not Schwab quotes or a reader's transactions. A full year's cash is not paid monthly.
Build the historical numerator from issuer rows
Schwab's SCHD distribution history supplies each amount and date below. The four income rows are in the same post-split per-share unit; this worksheet does not mix in pre-split amounts. It uses calendar 2025 as a closed historical interval, not the trailing twelve months ending today.
| Ex-date | Payable date | Income per share | Cumulative |
|---|---|---|---|
| 2025-03-26 | 2025-03-31 | $0.2488 | $0.2488 |
| 2025-06-25 | 2025-06-30 | $0.2602 | $0.5090 |
| 2025-09-24 | 2025-09-29 | $0.2604 | $0.7694 |
| 2025-12-10 | 2025-12-15 | $0.2782 | $1.0476 |
Download the four source rows (CSV). Sum: $0.2488 + $0.2602 + $0.2604 + $0.2782 = $1.0476 per share.
Hold the numerator still; change only the denominator
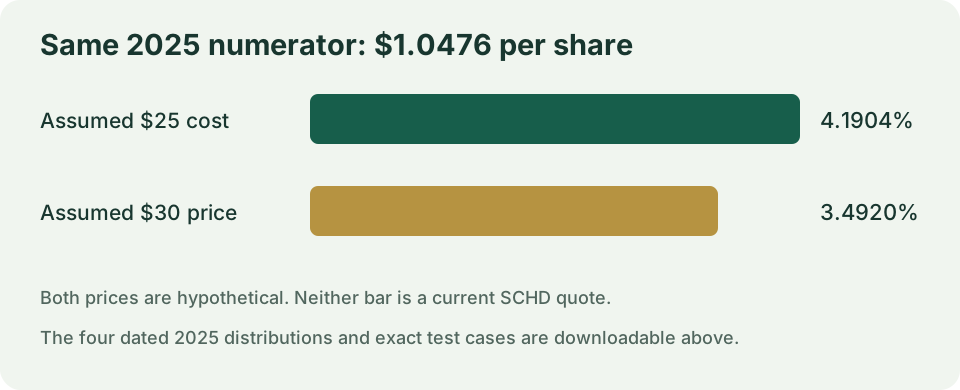
Under a hypothetical $25 paid per share, $1.0476 ÷ $25 × 100 = 4.1904% yield on that assumed cost. Replacing only the denominator with a hypothetical $30 comparison price gives $1.0476 ÷ $30 × 100 = 3.4920%. The income per share has not moved; the denominator alone accounts for the 0.6984-percentage-point difference. Because $30 is a made-up test input, 3.4920% must not be labeled today's market yield.
For an assumed 1,000 unchanged shares, the same issuer rows produce 1,000 × $1.0476 = $1,047.60 historical gross cash, whichever denominator is displayed. The monthly budgeting equivalent is $1,047.60 ÷ 12 = $87.30, but the four payable dates above remain quarterly receipts. A yield percentage is a ratio; changing a comparison price in a worksheet does not rewrite already observed distributions or deposit new cash.
Hold the denominator still; change only the numerator
Annualizing the last 2025 payment as a sensitivity test gives 4 × $0.2782 = $1.1128 per share. At the same assumed $25 cost, $1.1128 ÷ $25 × 100 = 4.4512%. This exceeds the four-observed-payment result by $0.0652 per share, $65.20 for 1,000 assumed shares, or 0.2608 percentage points at the assumed $25 denominator. The difference is the method's repetition of one quarter, not a fifth Schwab payment.
Schwab defines its own distribution yield (TTM) as trailing twelve-month income distributions divided by the last month's ending NAV, with capital-gain distributions excluded. A calendar-2025 total divided by a hypothetical cost, or a latest-quarter-times-four example, uses a different window or denominator. Our calculated ratios must therefore stay visibly separate from the issuer's displayed TTM and SEC yield fields. A future quarterly amount is unknown until declared.
Read Schwab's metric definition before comparing a vendor's yield label to this worksheet. A percentage without its numerator period and denominator date cannot resolve a disagreement.
Download and rerun the denominator and boundary checks
The test matrix holds the distribution sum fixed while changing cost from $25 to $30, then holds $25 fixed while changing the numerator to the final-payment annualization. It also distinguishes a valid zero-share cash result from an undefined yield: at zero shares the per-share ratio still calculates, but modeled owned cash is $0.00; at a zero-dollar denominator the yield is undefined, never 0%. A missing price or distribution is unknown, never silently converted to a zero input.
| Case | Numerator $/share | Assumed denominator $/share | Shares | Yield | Gross cash |
|---|---|---|---|---|---|
| 2025 sum / assumed cost | 1.0476 | 25 | 1000 | 4.1904% | $1047.60 |
| latest 2025 payout x4 / assumed cost | 1.1128 | 25 | 1000 | 4.4512% | $1112.80 |
| 2025 sum / assumed comparison price | 1.0476 | 30 | 1000 | 3.4920% | $1047.60 |
| zero shares | 1.0476 | 25 | 0 | 4.1904% | $0.00 |
| zero denominator | 1.0476 | 0 | 1000 | undefined / unknown | $1047.60 |
| missing price | 1.0476 | unknown | 1000 | undefined / unknown | $1047.60 |
| missing distribution | unknown | 25 | 1000 | undefined / unknown | unknown |
Download all expected cases (CSV). Blank numeric output cells signal unknown or undefined; they are not measured zeros.
Questions this SCHD calculator audit answers
Does a higher yield on cost mean SCHD will pay more next quarter?
No. Yield on cost uses an individual purchase denominator. It says nothing by itself about an undeclared next payment. Check the issuer distribution record for actual ex-dates and payable dates.
Why does a latest-payment calculator show a bigger percentage?
In this closed-2025 test, repeating the final $0.2782 four times produces $1.1128, whereas the four distinct observed payments total $1.0476. The method and window differ; neither example predicts the next four payments.
Can I use the $30 row as SCHD's current yield?
No. $30 is an expressly hypothetical denominator used to isolate a formula effect. A current market-price comparison requires a timestamped observed quote; Schwab's official TTM metric instead uses its stated NAV convention.
Where should I enter an assumption for a forward scenario?
Use our SCHD dividend calculator with clearly chosen inputs. Its future outputs are model scenarios, not the four issuer payments in this historical worksheet.
Sources, method and scope
Schwab's SCHD fund page is the source of the four dated income distributions. Schwab's definitions explains its TTM denominator. A public reader question about yield on cost motivated the numerator/denominator comparison; its replies provide no numeric inputs here. The fixed DRIPCalc, Snowball and Wisesheets sample was checked for page structure; the arithmetic, denominator isolation, zero-share and undefined-denominator matrix here were independently computed for this page. This sample-limited editorial comparison is not a claim about the entire web or future returns.
