How to enter pre-split SCHD shares without triple-counting income
The answer in one calculation
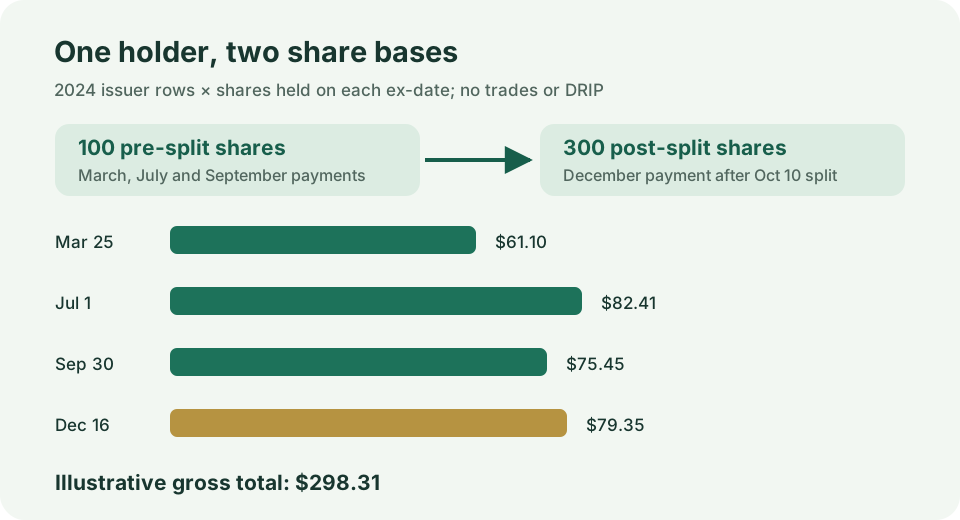
Use the shares actually held for each historical distribution. SCHD's 3-for-1 split took effect on October 10, 2024. A holder with 100 shares before it had 300 afterward, assuming no other trades. Schwab's first three 2024 payout rows belong with 100 shares in this example; its December row belongs with 300.
With no buys, sales or reinvestment, the four modeled gross payments are $61.10 + $82.41 + $75.45 + $79.35 = $298.31. The issuer supplies the distribution amounts; the share count and arithmetic are our explicit example. This is not a forecast, yield, tax calculation or account statement.
Keep the issuer's two share bases visible
Schwab's SCHD page says the split was effective October 10, 2024, applied to holders of record at the October 9 close, and began post-split trading October 11. Its distribution history lists $0.6110 (March 25 payable), $0.8241 (July 1), $0.7545 (September 30), then $0.2645 (December 16). I checked the issuer rows on September 28, 2026. The first three amounts are the issuer's historical, unadjusted figures; the last is after the split.
The split alone did not multiply the value of a position. It changed its unit count. This page holds the hypothetical investor's position constant across the split and uses the issuer's original per-share amounts. It does not claim that the four per-share amounts are comparable as a growth series without adjustment.
A cash ledger you can recompute
For each row, modeled gross dollars equal issuer dollars per share multiplied by shares assumed held on that ex-date. The payable date controls the cash-window filter below; it does not prove this hypothetical investor's eligibility. In this worked case, the holding is assumed to span all four ex-dates.
| Ex-date / payable | Issuer $/share | Example shares | Multiplication | Gross |
|---|---|---|---|---|
| Mar 20 / Mar 25 | $0.6110 | 100, pre-split | 0.6110 × 100 | $61.10 |
| Jun 26 / Jul 1 | $0.8241 | 100, pre-split | 0.8241 × 100 | $82.41 |
| Sep 25 / Sep 30 | $0.7545 | 100, pre-split | 0.7545 × 100 | $75.45 |
| Dec 11 / Dec 16 | $0.2645 | 300, post-split | 0.2645 × 300 | $79.35 |
| Total | 61.10 + 82.41 + 75.45 + 79.35 | $298.31 |
Download the event ledger CSV. The file retains ex-dates, payable dates, issuer values, the share basis, assumed shares and each multiplication. It deliberately does not rewrite Schwab's older amounts into an adjusted price series.
Two easy mistakes, with measured differences
If you keep the old 100-share count for all four rows, the model returns $245.41. It misses $52.90 because December should use 300 shares in the no-trade example. If you instead multiply every unadjusted issuer row by 300 current shares, the model returns $736.23, overstating this example by $437.92. Both errors mix a share count from one basis with distribution amounts from another.
An alternative is to divide each pre-split per-share amount by three and multiply by 300 post-split shares. Keep full precision until the cash sum: $0.6110 ÷ 3 × 300 still equals $61.10. Rounding the adjusted per-share number to four decimals first can change the total by a cent in this 100-share example. This worksheet avoids that extra rounding step by using the original issuer amounts with the matching share count.
Replay a 2024 payable-date window
Enter a whole number of shares held before the split and choose an inclusive window. The tool assumes that count at the first three ex-dates and three times it at the December ex-date; it never predicts future dividends. Zero shares or a window before the first payable date gives a valid zero result. Negative, fractional, missing or out-of-year inputs are rejected rather than being mistaken for zero.
Default: four payable dates; 100 shares before the split and 300 after; $298.31 modeled gross.
For a household cash plan, compare the dated receipts with bills in the monthly cash-flow ledger. A monthly average does not move a quarterly payment into an earlier month.
Boundary tests instead of a blank answer
The downloadable expected-output tests hold the issuer rows fixed and change one input or endpoint at a time. A result of zero is not an error if no shares or no payable date match; a negative share count is an error, not a zero-dollar payment.
| Test | Pre-split shares | Inclusive payable window | Matched | Expected gross |
|---|---|---|---|---|
| Zero shares | 0 | Jan 1–Dec 31 | 4 | $0.00 |
| Before first payment | 100 | Jan 1–Mar 24 | 0 | $0.00 |
| First date included | 100 | Jan 1–Mar 25 | 1 | $61.10 |
| Full year | 100 | Jan 1–Dec 31 | 4 | $298.31 |
| After split only | 100 | Oct 10–Dec 31 | 1 | $79.35 |
| Negative shares | −1 | Jan 1–Dec 31 | — | Rejected input |
Moving the end from March 24 to March 25 adds exactly one payable-date row. The test deliberately uses payable dates for cash timing; a tax record, entitlement check or ex-date-based calculator answers a different question.
Limits and questions
Did the split itself increase my dividend income threefold?
No. The unit count tripled while the unit scale changed. A future distribution amount is set separately; this historical ledger is not a promise that any future cash amount stays constant.
Why might a historical chart show roughly one-third of Schwab's older per-share number?
A chart can restate older per-share amounts on a post-split basis to compare periods. That is a different presentation from Schwab's listed historical rows. Check the chart's adjustment policy before multiplying by your share count; never divide both the amount and the old share count.
Can I use this for my actual 2024 brokerage account?
Only if its assumptions match. The tool does not read trades, DRIP lots, fractional shares, tax withholding or broker-level rounding, and it does not determine ex-date eligibility. Use your account statements for the shares actually held on each ex-date.
Does the annual total tell me today's yield?
No. This is a cash calculation for an explicitly assumed 2024 position using historical issuer rows. Yield needs a defined denominator and date; present and future distributions can differ.