SCHD Growth Calculator
The answer from completed issuer rows
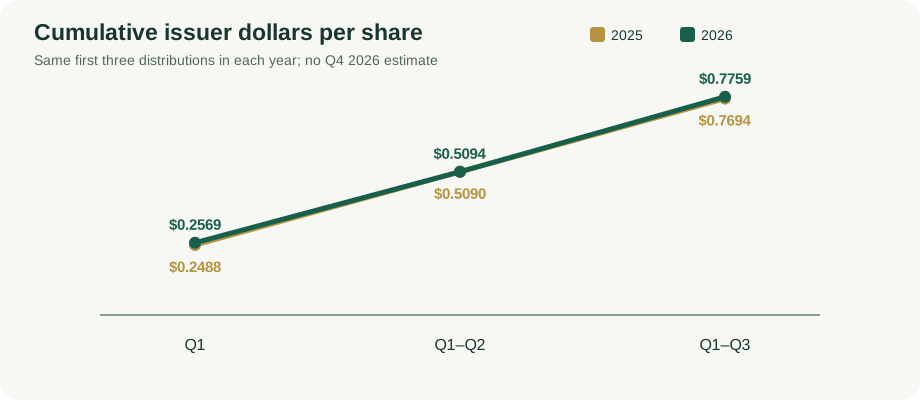
Through Q3, Schwab lists $0.7759/share in 2026 versus $0.7694 in 2025: +0.8448% across matching payments. The difference is $0.0065 per share. With 100 shares assumed eligible for all three payments in each year, that is $77.59 versus $76.94 in gross cash, a $0.65 difference. These are our sums and divisions of Schwab's six dated rows, not a rate published by Schwab.
This is observed distribution cash growth through Q3. It is not full-year 2026 growth, SCHD price appreciation, total return, a promise about future payouts, or an investment recommendation. The official distribution table read on October 1 showed no Q4 2026 row; this worksheet leaves that quarter unknown rather than filling it with last year's amount. Both comparison years follow SCHD's October 2024 share split, so the displayed rows use the same post-split per-share basis.
Six issuer observations, with both dates kept separate
The following ex-dates, payable dates and income amounts per share are displayed in Schwab's SCHD distribution section, checked October 1, 2026. They are historical issuer observations. Share counts in our examples are assumptions about an investor, not data from Schwab. The first three quarters are aligned by payment sequence, not by the same calendar day in each year.
| Year | Quarter | Ex-date | Payable date | Income USD/share |
|---|---|---|---|---|
| 2025 | Q1 | 2025-03-26 | 2025-03-31 | $0.2488 |
| 2025 | Q2 | 2025-06-25 | 2025-06-30 | $0.2602 |
| 2025 | Q3 | 2025-09-24 | 2025-09-29 | $0.2604 |
| 2026 | Q1 | 2026-03-25 | 2026-03-30 | $0.2569 |
| 2026 | Q2 | 2026-06-24 | 2026-06-29 | $0.2525 |
| 2026 | Q3 | 2026-09-23 | 2026-09-28 | $0.2665 |
Download the six issuer rows as CSV. That file retains the official page URL and this review date beside every row; recheck the issuer if using it later.
Reproduce the like-for-like calculation
2025 Q1–Q3 per-share cash = $0.2488 + $0.2602 + $0.2604 = $0.7694. 2026 Q1–Q3 = $0.2569 + $0.2525 + $0.2665 = $0.7759. Difference = $0.7759 − $0.7694 = $0.0065. Comparable-period change = $0.0065 ÷ $0.7694 × 100 = 0.8448%, rounded only at display.
Stopping after Q1 gives a different result from stopping after Q3: the first 2026 payment exceeded its 2025 counterpart, the Q2 payment was lower, and Q3 raised the cumulative difference again. The selector below recomputes all three cumulative checkpoints from the same source rows. This is why one quarterly payment should not be multiplied by four and called an observed annual growth rate. Each checkpoint compares the same number of already listed payouts, not a forecast of the unlisted fourth quarter.
| Rows compared | 2025 USD/share | 2026 USD/share | Difference/share | Change vs 2025 |
|---|---|---|---|---|
| Q1 | $0.2488 | $0.2569 | $0.0081 | 3.2556% |
| Q1–Q2 | $0.5090 | $0.5094 | $0.0004 | 0.0786% |
| Q1–Q3 | $0.7694 | $0.7759 | $0.0065 | 0.8448% |
Calculate your assumed cash difference
Choose one, two or three matching quarterly rows and a constant assumed eligible-share count. The calculator sums the two years separately before multiplying by shares; it does not claim that you personally held that count on every ex-date. The percentage uses the earlier year's per-share sum as its denominator, so entering zero shares still yields a meaningful observed per-share percentage while modeled account cash stays zero.
Default: 100 assumed shares, Q1–Q3. 2025 cash $76.94; 2026 cash $77.59; difference $0.65. Per-share change 0.8448%.
A blank share field is unknown, not zero; a negative or nonfinite count is invalid. A Q4 request is outside this six-row fixture and has no numeric output. The tool does not estimate reinvestment execution price, taxes, future share-price growth or a complete 2026 annual dividend. For a different projection task, use the main SCHD dividend calculator; its editable growth rates are model assumptions, not issuer forecasts.
Check boundaries before trusting a result
At 100 assumed shares and all three matching rows, the cash difference is $0.65; at 1,000 it is $6.50 while the per-share growth percentage does not change. Zero shares makes both modeled cash totals $0.00, yet the issuer still paid the six nonzero per-share amounts. An empty share input is not the same as zero, and an unlisted Q4 row is not a zero-dollar distribution. The downloadable matrix freezes these distinctions as inputs, statuses and expected outputs rather than hiding them behind a single forecast number.
| Case | Matching quarters | Shares | Status | Cash difference |
|---|---|---|---|---|
| Q1 comparison | 1 | 100 | valid | $0.81 |
| first two quarters | 2 | 100 | valid | $0.04 |
| three-quarter default | 3 | 100 | valid | $0.65 |
| large share assumption | 3 | 1000 | valid | $6.50 |
| zero shares | 3 | 0 | valid | $0.00 |
| fractional shares | 3 | 10.5 | valid | $0.07 |
| missing shares | 3 | blank | missing_input | unknown |
| negative shares | 3 | -1 | invalid_input | unknown |
| unconfirmed Q4 | 4 | 100 | outside_fixture | unknown |
Download the complete input-and-expected-output CSV. The missing, invalid and out-of-coverage cases leave numeric result cells blank. This is a reproducible test of our worksheet, not evidence of a future Schwab payment.
Questions about what this growth number means
Is 0.8448% SCHD's annual dividend growth rate?
No. It compares the first three issuer-listed payments of 2026 with the first three of 2025. It excludes a not-yet-listed fourth 2026 row and says nothing about a future annual total.
Does this include the change in SCHD's market price?
No. The numerator contains only cash distributions per share. Price movement and reinvestment can change an investor's total return; this worksheet has neither a dated purchase price nor a broker reinvestment execution record.
Why do zero shares still show a per-share change?
The percent compares the fund's two cumulative per-share distributions, which do not depend on a hypothetical account. Multiplying by zero assumed eligible shares makes modeled account cash zero. These are different units and should stay separate.
Can I use this number as next year's growth input?
Only as your own scenario assumption after you decide it fits your purpose. A partial-year historical comparison is not an issuer forecast, and future distributions may differ. The main calculator lets you change its assumptions openly.
Source, formula and reading limits
Issuer rows and split notice: Schwab Asset Management SCHD product and distributions page, body read October 1, 2026. All six dates and amounts were checked against its distribution section and retained in the downloadable source CSV. No competitor estimate supplies the numbers on this page.
Our method: group by the first three issuer-listed quarterly payouts in each year, sum dollar-per-share amounts within the same cutoff, compute (new sum − earlier sum) ÷ earlier sum × 100, and separately multiply each sum by an explicitly assumed constant eligible-share count. Cash is gross before any account-specific withholding or reinvestment. The three-site benchmark informed the angle but does not prove uniqueness across the web. This educational worksheet is not investment advice.
Related tasks: use the date-window worksheet to compare ex-date and payable-date filtering within a historical year, or the input-unit audit to check annual versus per-payment entries. Those answer different questions from this matching-quarter growth comparison.