Why two SCHD dividend calculators can disagree
Check the unit before the result
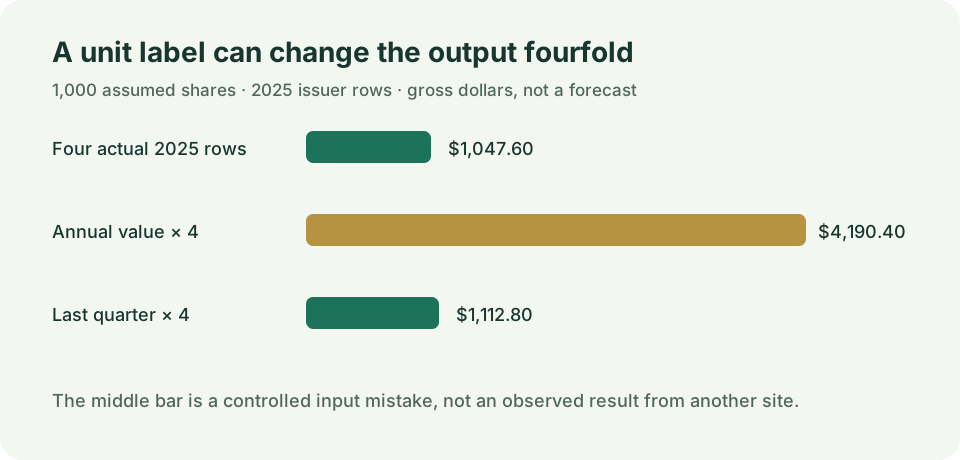
An annual total per share is not one quarterly payment per share. Schwab lists four 2025 SCHD distributions totaling $1.0476 per share. With a hypothetical 1,000 shares held across all four ex-dates and no trades or reinvestment, the historical gross is $1,047.60. If the same $1.0476 is entered into a model that treats it as each of four payments, that model computes $4,190.40—four times the historical result. The difference is caused by the unit label in this controlled test; it does not prove that any named calculator is broken.
This page also isolates two other choices that can change a model: when a hypothetical growth rate first applies, and whether reinvested cash buys fractional shares. It cannot diagnose an outside tool without that tool's complete formula and repeatable inputs.
Fix the historical source rows first
Schwab's SCHD distribution records list the 2025 payable dates and per-share amounts below. I checked the issuer page on September 29, 2026. These are historical payments, not a current forward rate or promise of future amounts. The 1,000-share holding in the examples is an assumption.
| Ex-date | Payable date | Issuer $/share | 1,000-share gross |
|---|---|---|---|
| Mar 26 | Mar 31 | $0.2488 | $248.80 |
| Jun 25 | Jun 30 | $0.2602 | $260.20 |
| Sep 24 | Sep 29 | $0.2604 | $260.40 |
| Dec 10 | Dec 15 | $0.2782 | $278.20 |
| Four-row total | 2025 payable year | $1.0476 | $1,047.60 |
Download these dated issuer inputs as CSV. For a different cash question, the monthly cash ledger shows when these four receipts arrived relative to bills.
Fixture 1: annual total or one payment?
Hold share count at 1,000 and change only what the entered per-share number means. The actual 2025 four-row sum is $1.0476, so 1,000 × $1.0476 = $1,047.60 gross. A form that asks for one quarterly distribution may multiply an entered value by four to make a run rate. Put the annual $1.0476 there and the result becomes $4,190.40; the extra $3,142.80 is not money Schwab paid in 2025.
Using the last 2025 payment, $0.2782, as a hypothetical constant quarterly amount gives 1,000 × $0.2782 × 4 = $1,112.80. That is $65.20 above the actual 2025 total because the four real payments were not identical. It is a simple annualized run rate, not a recitation of the four historical events. Label those two outputs differently before comparing them.
Fixture 2: when does growth start?
A long-range projection needs a time convention. Suppose, only for a sensitivity test, that a user enters 5% annual dividend growth and fixes the historical baseline at $1,047.60 for 1,000 shares. If a model applies that assumed rate before displaying the first modeled year, it shows $1,047.60 × 1.05 = $1,099.98. If it displays the source year first and grows only afterward, the first line is $1,047.60 and the following modeled year is $1,099.98. The first displayed lines differ by $52.38 without either model changing the source record.
Five percent here is an invented scenario input, not Schwab guidance, a forecast or a measured growth rate. Do not add this growth factor to actual 2025 cash and then describe the result as what happened in 2025.
Fixture 3: what happens to reinvested cash?
Schwab describes DRIP as reinvesting cash distributions into additional whole or fractional shares. An issuer payment amount alone does not reveal a customer's execution price. To show why two share-count models can diverge, assume the March 2025 $248.80 gross from 1,000 shares was reinvested at an explicitly hypothetical $25.00 per share. An exact fractional model adds 248.80 ÷ 25.00 = 9.952 shares. A deliberately whole-only model adds nine and leaves $23.80 uninvested.
If both models then apply the official June $0.2602 per-share payment to their different illustrative share counts, the fractional case is (1,000 + 9.952) × $0.2602 = $262.7895104, displayed as $262.79; the whole-only case is (1,000 + 9) × $0.2602 = $262.5418, displayed as $262.54. The displayed difference is $0.25. This is not a claim about your broker's actual fill or the behavior of either named comparison site. Actual reinvestment records and rounding rules belong to your account statement.
Run the unit test yourself
Enter a whole assumed share count, a nonnegative per-share amount with up to four decimals, and what that amount represents. “Annual total” uses it once. “One payment repeated quarterly” uses it four times. This intentionally narrow calculator does not model price, taxes, contributions, dates, DRIP or growth.
Default: 1,000 × $1.0476 annual total = $1,047.60 modeled gross.
Download the expected-output and rejection cases as CSV. The fixture changes one unit at a time and deliberately includes valid zeroes and invalid negative inputs.
Boundary tests that stop false comparisons
| Case | Shares | Per-share input | Unit | Expected gross/state |
|---|---|---|---|---|
| 2025 historical total | 1,000 | $1.0476 | Annual total | $1,047.60 |
| Annual value misread | 1,000 | $1.0476 | One quarterly payment ×4 | $4,190.40 |
| Latest quarter repeated | 1,000 | $0.2782 | One quarterly payment ×4 | $1,112.80 |
| Zero shares | 0 | $1.0476 | Annual total | $0.00 |
| Zero per-share amount | 1,000 | $0.0000 | Annual total | $0.00 |
| Negative or missing unit | — | — | Invalid | Reject, do not display $0 |
The “annual value misread” row is mathematically valid under its stated multiplication but uses the wrong label for a historical 2025 comparison. A zero result is valid only after inputs are valid; an invalid or missing field is unknown/error, not zero.
A comparison checklist and common questions
Before deciding that two SCHD calculators disagree, write down seven choices beside each output: share count and split basis; source date; annual versus per-payment input; number of payments; when growth first applies; whether contributions enter before or after a payment; and DRIP execution price, fractional-share precision and tax treatment. Change one item at a time. If a tool does not disclose a choice, mark it unknown instead of inventing its formula.
Which value belongs in a quarterly dividend input?
If the field really means one payment per share, use a single payment amount for an explicitly hypothetical repeated-payment model. To reproduce a past calendar year, use all four issuer rows instead of pretending they were equal.
Does a fourfold result prove a calculator bug?
No. This page constructs a fourfold difference by placing a yearly total in a per-payment field. Inspect both tools' labels and calculations before attributing a real result to an error.
Can a latest-payment run rate equal the historical year?
Only by coincidence. The last 2025 payment multiplied by four yields $1,112.80 for 1,000 shares; the four actual 2025 rows yielded $1,047.60 in this fixed-share example.
Can I derive my DRIP share count from Schwab's distribution table?
Not by itself. The issuer table gives distribution per share. You also need account shares, eligibility, execution price, timing, precision and any uninvested cash. Do not label this illustrative $25.00 execution price as a historical market quote.
What if the input is zero or missing?
Zero shares or a verified zero per-share amount can calculate to zero. A missing amount, invalid period label or failed source fetch must be shown as an error or unknown; see the separate zero-result test matrix.
Check the display currency too
The fixtures above use USD throughout. A mixed-currency export needs a separate conversion contract: see the USD and CAD unit reconciliation. Its rates are hypothetical, not current bank quotes.
