Which SCHD dividends belong in your date range?
The answer for one boundary window
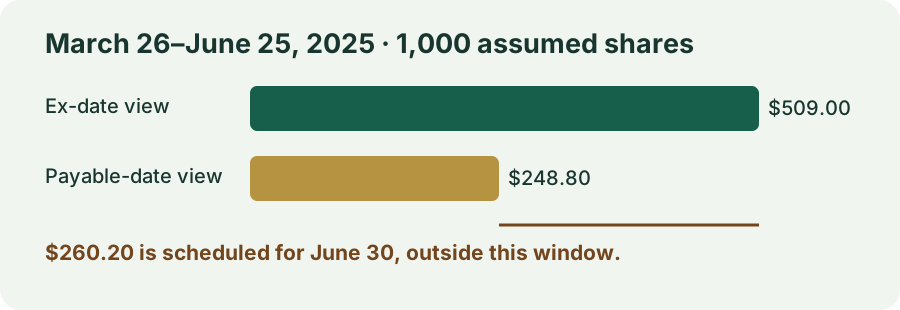
March 26 through June 25, 2025 includes two SCHD ex-dates but only one payable date. Schwab's $0.2488 and $0.2602 per-share distributions produce an ex-date total of $0.5090 per share. Only the March 31 payment falls inside the cash-date window, or $0.2488 per share. With 1,000 explicitly assumed eligible shares, the two views are $509.00 versus $248.80; the $260.20 difference is the June distribution scheduled for June 30, outside the chosen end date.
This is a fixed, historical 2025 date-filter exercise. The ex-date view is an eligibility-date grouping, not cash available to spend. The payable-date view uses the issuer's scheduled payment date, not a verified posting time in your own brokerage account. It does not calculate a live yield, future income, taxes, or a trading decision.
Choose the date that matches your question
Use the ex-date to group distributions by the date that determines whether a purchase is too late for that payment; the SEC explains that buying on or after the ex-date does not qualify for the next distribution. Use the payable date to group the dates on which Schwab says it will pay the distribution. Neither column proves your personal holdings or the exact date your broker credited cash.
The tool below treats both endpoints as inclusive. It multiplies each selected official per-share amount by one constant share-count assumption. If you bought, sold, reinvested, or held a different number of shares at each ex-date, replace that constant assumption with your account's dated positions. A date window is also not automatically a trailing twelve months: that label needs a specified ending day and a complete source period.
The source rows and exactly what the example includes
These four 2025 rows come from Schwab's SCHD distribution history, read on October 1, 2026. Amounts are issuer dollars per share on the post-2024-split basis. The final two columns are our own inclusive-window checks for March 26–June 25; they are not source fields.
| Ex-date | Payable date | USD/share | Ex view | Payable view |
|---|---|---|---|---|
| 2025-03-26 | 2025-03-31 | $0.2488 | Yes | Yes |
| 2025-06-25 | 2025-06-30 | $0.2602 | Yes | No |
| 2025-09-24 | 2025-09-29 | $0.2604 | No | No |
| 2025-12-10 | 2025-12-15 | $0.2782 | No | No |
Download the four source rows as CSV. Cross-check each amount and both dates against the issuer before using a different historical period.
Recompute the $260.20 timing gap
Ex-date amount = $0.2488 + $0.2602 = $0.5090/share. Payable-date amount = $0.2488/share. Difference = ($0.5090 − $0.2488) × 1,000 assumed shares = $260.20.
Move the end date from June 25 to June 30 without changing the starting date or shares: the June 30 payable row enters, so both totals become $509.00 and the gap closes to $0.00. Conversely, select June 26–June 30: there is no ex-date event in that narrow window, while one $260.20 payment belongs in the payable-date view. These opposite signs are a date-filter effect, not a change in the issuer's per-share amount.
Re-run both date rules for a 2025 window
Choose an inclusive start and end inside 2025 and a constant, nonnegative eligible-share assumption. This calculator uses only the four issuer rows above. It refuses windows outside the fixture instead of silently returning zero for dates it does not cover.
Default: ex-date view $509.00 from 2 events; payable-date view $248.80 from 1 event; ex minus payable $260.20.
If the form reports no matching rows within 2025, that is a valid zero for this selected window. A request outside the closed 2025 fixture is unknown here, not zero. This is a date-and-share worksheet, not a DRIP price or broker-statement calculator; use our SCHD DRIP reconciliation for the separate cash-to-shares step.
Zero, opposite-sign, and out-of-coverage checks
The downloadable test matrix freezes each input and expected output. The March 26–30 case has one ex-date event and zero payable-date events, so its payable-date total is $0.00 for 1,000 assumed shares. January 1–March 25 has no matching 2025 row under either rule. Zero assumed shares returns $0.00 cash even when event counts remain nonzero; that does not mean Schwab paid zero per share.
| Case | Inclusive dates | Shares | Status | Ex cash | Pay cash |
|---|---|---|---|---|---|
| main window | 2025-03-26–2025-06-25 | 1000 | valid | $509.00 | $248.80 |
| before first payment | 2025-03-26–2025-03-30 | 1000 | valid | $248.80 | $0.00 |
| payable only june | 2025-06-26–2025-06-30 | 1000 | valid | $0.00 | $260.20 |
| empty within 2025 | 2025-01-01–2025-03-25 | 1000 | valid | $0.00 | $0.00 |
| zero shares | 2025-03-26–2025-06-25 | 0 | valid | $0.00 | $0.00 |
| full 2025 | 2025-01-01–2025-12-31 | 1000 | valid | $1047.60 | $1047.60 |
| outside fixture unknown | 2026-01-01–2026-01-31 | 1000 | outside_fixture | unknown | unknown |
| reversed dates error | 2025-06-25–2025-03-26 | 1000 | invalid_range | unknown | unknown |
Download all input and expected-output cases as CSV. The outside-2025 and reversed-date rows deliberately leave numeric outputs blank. Filling them with $0.00 would falsely turn missing coverage or invalid input into an observed no-payment result.
Questions before using the two totals
Did the $260.20 disappear?
No. In this example the June event qualified under the June 25 ex-date filter, while Schwab's payable date was June 30. Extend the end date through June 30 and the payable-date view catches up. This says nothing about whether any particular broker posted cash on that exact day.
Which number can I treat as spendable cash?
Neither without account verification. The ex-date number is never a cash posting. The payable-date number is an issuer-date estimate under the constant-share assumption; check your statement for eligibility, actual posting, reinvestment, withholding and adjustments. For a separate bill-timing exercise, see our 2025 cash-flow ledger.
Is this a current trailing-twelve-month dividend yield?
No. It contains only 2025 historical payments and does not fetch a current share price. A rolling twelve-month calculation requires a named end date, a complete overlapping event series and an explicit date rule. Dividing this closed-year amount by today's price would answer a different question and would need a separately sourced price.
Why can a zero-result test still show a distribution?
A zero in one view means no date of that type falls in the chosen window. March 26–30 includes an ex-date but not the March 31 payment date. Zero shares means modeled account cash is zero despite a nonzero issuer per-share distribution. These are different reasons for zero and should not be merged.
Watch the date-window walkthrough
Watch the original DividendSteps explanation on YouTube. It uses synthetic English narration and the same Schwab 2025 rows and stated share assumption. The full method and downloadable CSVs are on this page; YouTube is optional.
Sources, method and limits
Issuer dates and amounts: Schwab Asset Management, SCHD distributions. Ex-date eligibility explanation: U.S. Securities and Exchange Commission investor glossary. A public reader asked whether their SCHD share count on ex-date or payable date governs their payment; that question motivated this date-rule audit, but the reader's post is not used as numerical evidence.
Method: filter the four dated issuer events with start ≤ selected date ≤ end, sum the per-share distributions, then multiply by the explicitly assumed constant eligible shares. The result is historical gross before any account-specific taxes or reinvestment. The fixed three-site comparison sample informed topic selection; it does not prove this worksheet is unique across the web. The page is educational and is not investment advice.
Return to the main SCHD dividend calculator for a different projection task.